
In this post titled Objective 3.3 - Configure diagnostics monitoring and analytics, we will be looking at the below sub-objectives:
- Set Retention policies and logging levels.
- Analyze logs.
In our previous posts on Azure IaaS VMs, we looked how we can configure logging for Azure VMs. Along the same lines, we will be looking at setting up logging for Azure Storage Accounts.
Set Retention Policies and Logging levels
Storage Logging occurs at server-side and allows you to record both successful and failed requests for an Azure Storage account. These logs can then be used to see details of write, read, and delete operations against various storage services.
It is important to note that Storage Analytics logging is currently available only for the Blob, Queue, and Table services.
The following information from the Storage Log entries:
- Start time, end-to-end latency, and server latency.
- Storage operation details such as the operation type, the key of the storage object the client is accessing, success or failure, and the HTTP status code returned to the client.
- Type of authentication the client used.
- The sizes of the request and response messages.
Storage Logging logs request data in a set of blobs in a blob container named $logs in your storage account. This container does not show up if you list all the blob containers in your account but you can see its contents if you access it directly.
You also need to be aware of the below when enabling Storage Logging on an Azure Storage Account.
- There are occasionally clock skews, if you are searching for log entries that relate to metrics data, you may need to search up to 15 minutes either side of the time recorded for the metrics data.
- You can download Log data. One can use PowerShell or AzCopy tool.
- Since the logging happens within the Storage Account and it consumes space, you will need to keep that in mind when enabling Storage Logging.
Now that we know all about Storage Logging, let us go ahead and try to enable it using the Azure Portal.
Once logged in, select the Storage Account > Diagnostics > Logging.
Select what you want to log and set the retention period as shown below.
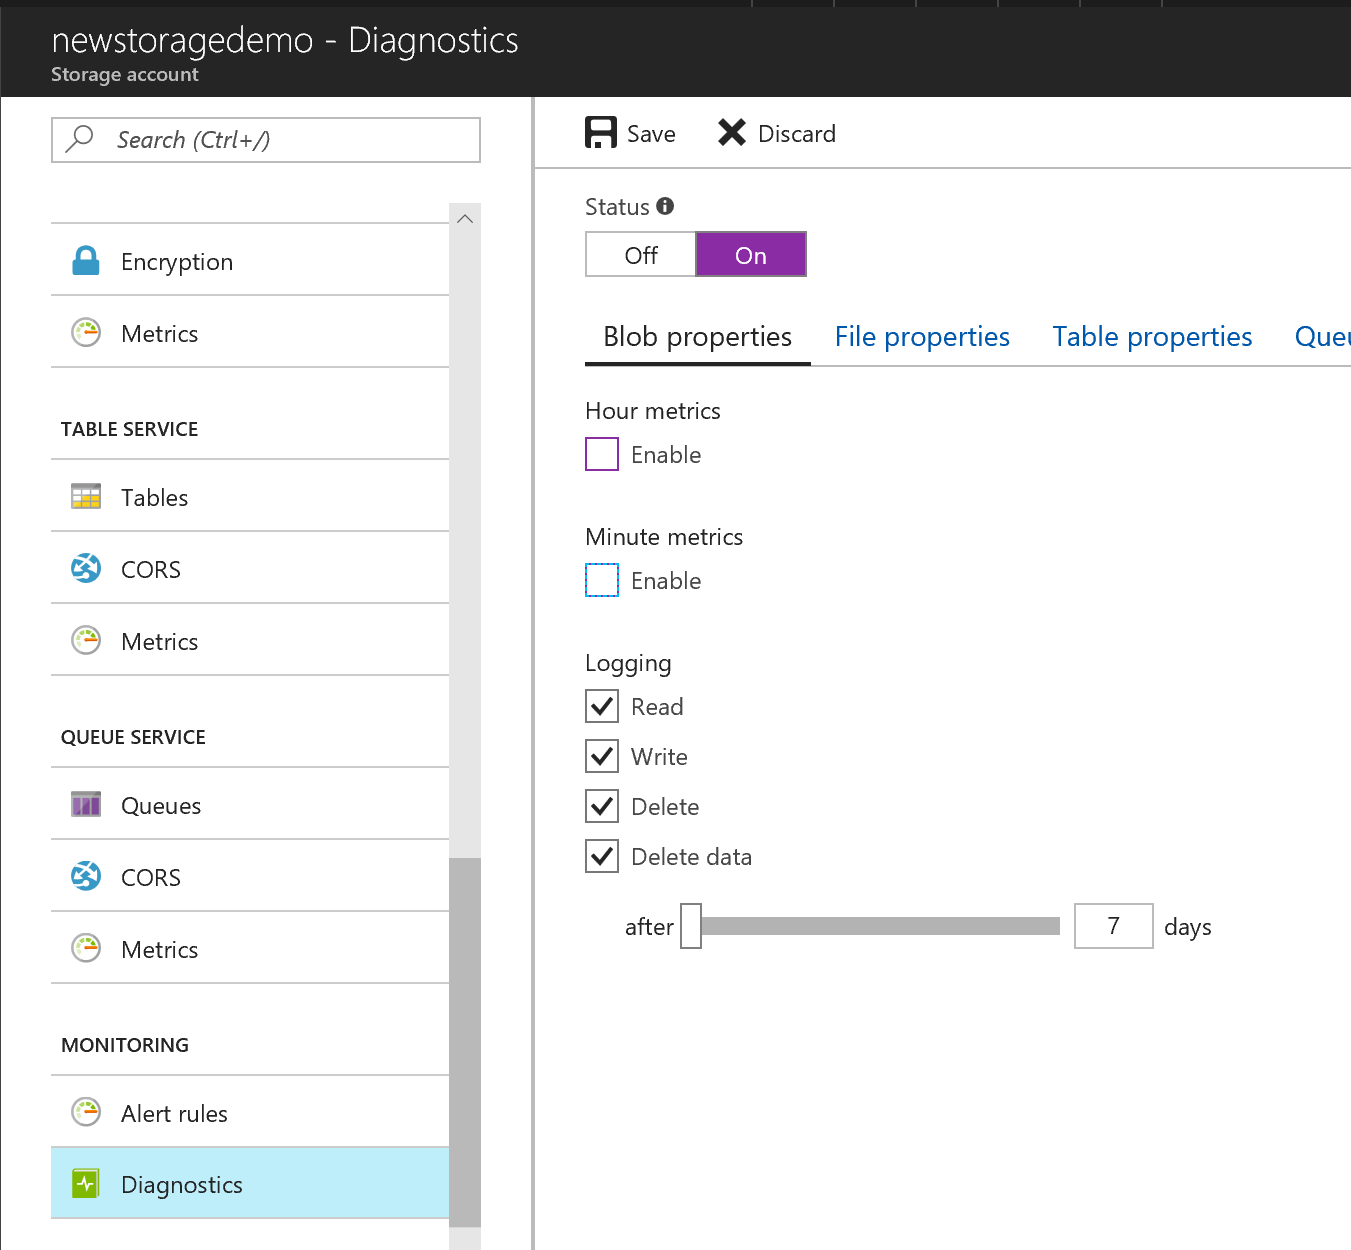
Click Save to save the changes.
You could perform this step using PowerShell. An example can be seen below.
Set-AzureStorageServiceLoggingProperty -ServiceType Queue -LoggingOperations read,write,delete -RetentionDays 5
Now that you have enabled the logging, logically the next step would be able to see the logs. As explained earlier, the log data is stored to blobs in a container named $logs in your storage account.
Within your $logs container, the blobs are named as follows:
<servicetype>/YYYY/MM/DD/HHMM/<counter>.log
The value of the service name is blob, table, or queue.
Analyze Logs
In the previous we went through the process of enabling logging for a storage account, so the next step should be able to understand what the logs say.
Each log entry follows a standard log format that is determined by the version of Storage Analytics Logging. The first field in a log entry always specifies the version number. Consumers of logging data can take a dependency on this field as well as the following aspects of a log entry:
- All fields, populated or empty, will be separated by a semicolon “;”
- Each log entry is separated by a newline character “\n”
- The last field in the entry will not end with a semicolon “;”
For example, below is the version 1 format:
<version-number>;<request-start-time>;<operation-type>;<request-status>;<http-status-code>;<end-to-end-latency-in-ms>;<server-latency-in-ms>;<authentication-type>;<requester-account-name>;<owner-account-name>;<service-type>;<request-url>;<requested-object-key>;<request-id-header>;<operation-count>;<requester-ip-address>;<request-version-header>;<request-header-size>;<request-packet-size>;<response-header-size>;<response-packet-size>;<request-content-length>;<request-md5>;<server-md5>;<etag-identifier>;<last-modified-time>;<conditions-used>;<user-agent-header>;<referrer-header>;<client-request-id>
Below is an excellent article which explains what these fields mean.
I hope this has been informative and thank you for reading!


