
This is going to be my first post in some time now and I am glad to let the audience that I was selected as a vExpert for the third consecutive year. In today's post, we will explore an awesome product called Runecast Analyzer.
I happen to stumble across this product when looking for a monitoring solution for my homelab and reached to my fine folks to get an NFR license to test the product. So, let's jump right into it.
What is Runcecast Analyzer?
Runecast is a Proactive monitoring solution which is using the known issue profiles and best practices documented in the VMware Knowledgebase and other sources to identify and expose potential issues within your VMware infrastructure before they manifest into outages.
It can do a lot more than just monitoring like collect logs from ESXi hosts and analyze those which helps in detecting any misconfigurations or issues. Runecast does this by comparing the logs to VMware Best practices guide and provides you with valuable information that would not be possible by a human.
Installation
Runecast Analyzer comes in the form of OVA which can be deployed using a vCenter Server and can be downloaded from their website https://runecast.biz/
I am sure all you folks out there know how to deploy an OVA so I am not going to go through the process in this article.
During the deployment, one of the decisions that you need to make is what is going to be the size of the appliance, which I would like to call as Deployment model.
Deployment Models
Runecast Analyzer can be deployed in three different sizes, which are:
- Small
- Medium
- Large
The system requirements are deiced based on the size of the appliance you select.
A small deployment is recommended for 1 vCenter and up to 10 ESXi hosts. It will consume 2vCPU, 4GB RAM, and 90 GB storage.
A medium deployment is recommended for 5 vCenter Servers and up to 100 ESXi hosts and will consume 4vCPU, 8GB RAM, and 90GB storage.
A large deployment is recommended for 15 vCenter Servers and 250 ESXi hosts and will consume 8vCPU, 32GB RAM, and 90 GB storage.
Port Requirments
- 443, 5988, 5989 from the Runecast appliance to vCenter and ESXi hosts.
- 514 UDP port from ESXi hosts to Runecast Analyzer for log collection.
- 443, 31415 to the Runecast Analyzer web interface.
- 5480 to the Runecast Analyzer admin interface.
Runecast Analyzer Configuration
Runecast Appliance is a customized Ubuntu Linux VM and the basic configuration can be done by accessing the VAMI page using the port 5480.
To connect to the VAMI, type https://<IP address>:5480
As said before, there are very basic things that can be performed on the VAMI page. It is basically for the OS and application management.
Some of the things that you can perform are described below.
Shutdown/Reboot the appliance
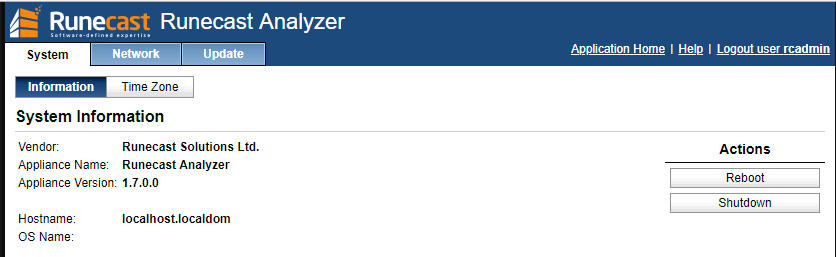
As soon as you log in to the VAMI page, the default username and password is rcadmin/admin, you will be presented with System Information, which shows the current version of the software, hostname and the ability to reboot/shutdown the appliance.
Network Settings
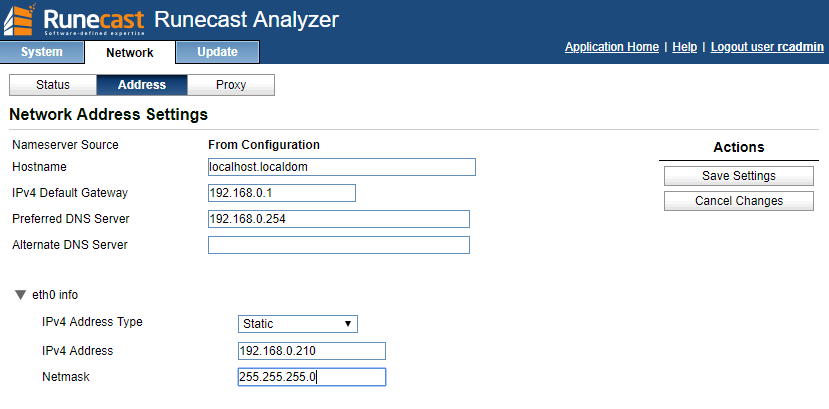
Once you click on the Network Tab > Address, you have the ability to change the IP address. In my case, I have assigned a static IP address and provided the DNS information.
Update the appliance
Another setting that you can configure from the VAMI page is the update settings. From the update tab, click on settings and you can select the way that updates will be applied to the appliance.
In my case, I am just asking it to check for the updates and let me know and I can decide to update or not.
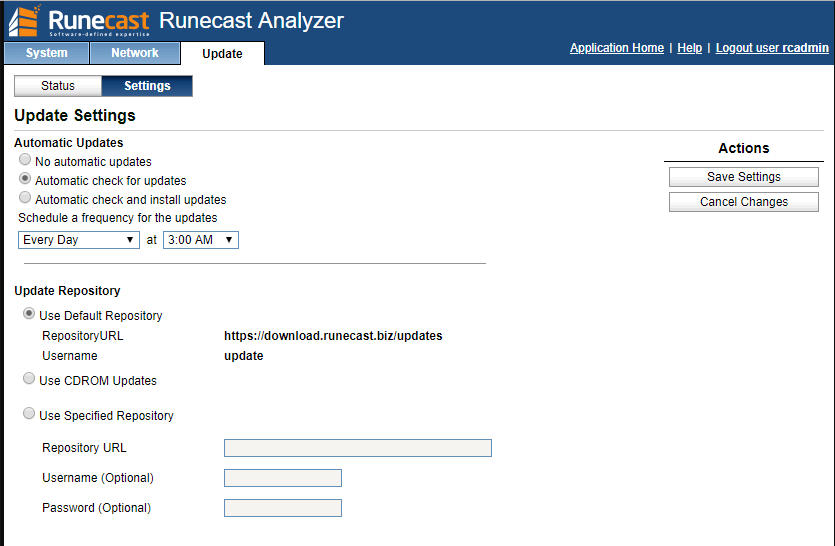
You can also select how you download the updates. In my case, I have configured the default repository since this is a lab setup, however, you could also download the offline bundle and configure the appliance to download from there.
Runecast Analyzer Login
We have now reached the stage where we will now login to the appliance and add our vCenter Server and start proactively monitoring our virtual infrastructure.
To log in to the appliance, just open your browser and type in the IP address of the appliance. The default username and password is rcuser/Runcecast!
As soon as you log in, you would be presented with the message stating that the vCenter Server isn't added. Click on Settings to Add the vCenter Server.
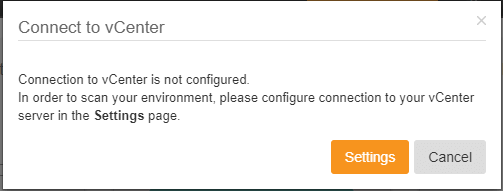
This will take you to the Settings page and redirected to vCenter connection settings, click on Add vCenter. We will explore the rest of the settings in the future.
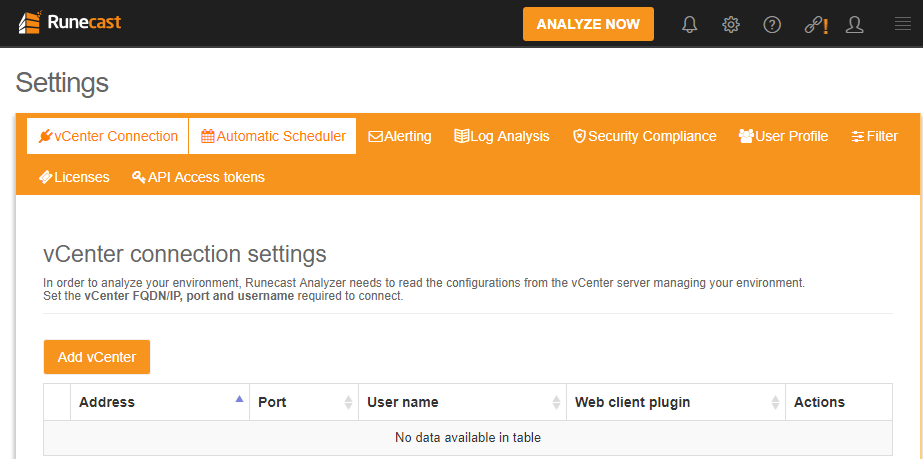
This will bring up a wizard, provide the vCenter Server name, the port number which is 443, username and password.
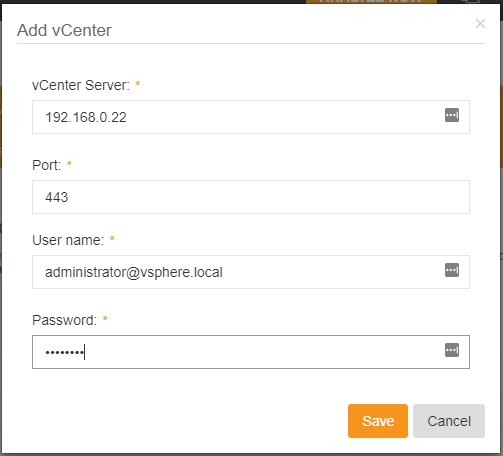
There are a certain set of permissions required to fetch the information from vCenter Server and ESXi hosts since I am adding the vCenter using the SSO administrator account, I am providing full access.
However, you may not want to do this on a production set up. Refer to the user guide for exact permissions.
Click Save to finish adding the vCenter Server.
There are certain limitations with the Trial license. Next step would be to add the license, I was able to get the license by contacting the amazing Runecast team.
Click on Settings > Licenses > Add License.
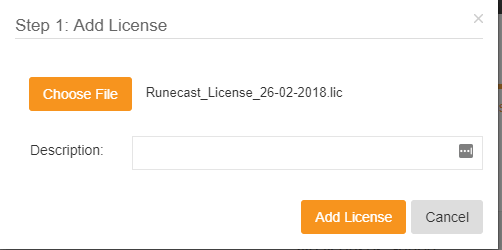
In the next step, you will be asked to select the hosts to license. Select the hosts from the “Unlicensed hosts” column and click “>” to move them to “Licensed hosts” on the right side. Click Assign License once you are done.
Once added, click on Analyze Now to starting monitoring your Virtual Infrastructure.

This will start collecting the Information and present it as valuable information in the Dashboard.
Runecast Analyzer Dashboard
There is a plenty of information available on the Dashboard as seen in the below image.
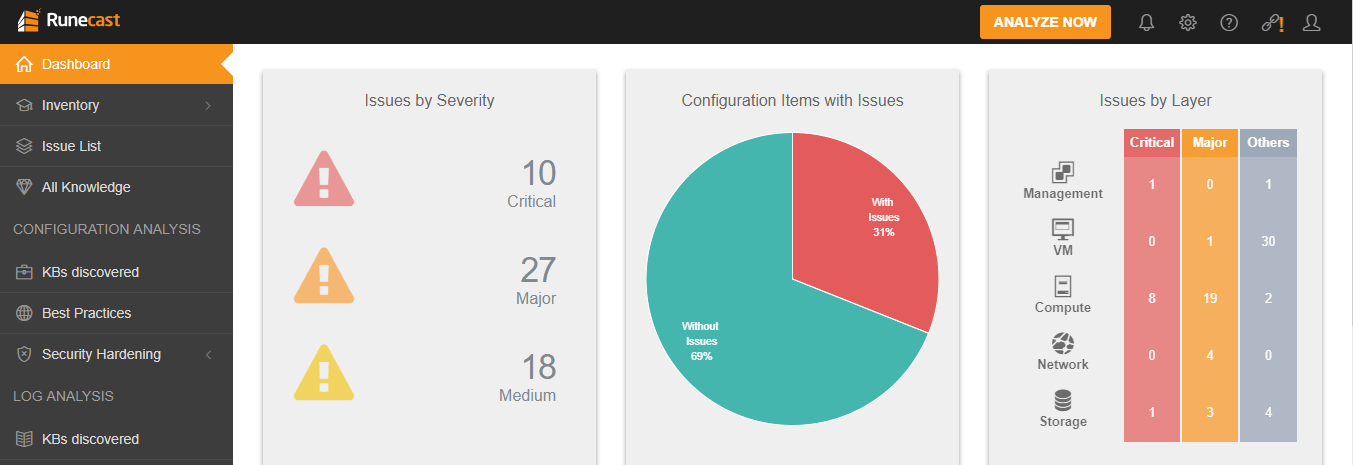
The Dashboard will present you with cards, which can be clicked to get more information.
In the above example, I have three cards, which are:
- Issues by Severity - This categorizes issues by severities and severity types are Critical, Major and Medium.
- Configuration Items with Issues - This is wheel shart which tells which categorizes the entire Infra issues in percentage.
- Issues by Layer - This is new in the latest version of the appliance, this categorizes issues by Layers and the layers are Management, VM, Compute, Network, and Storage.
Inventory List
Clicking on the Inventory tab will bring up the vCenter structure and you can then look at issues at each object level as seen below.
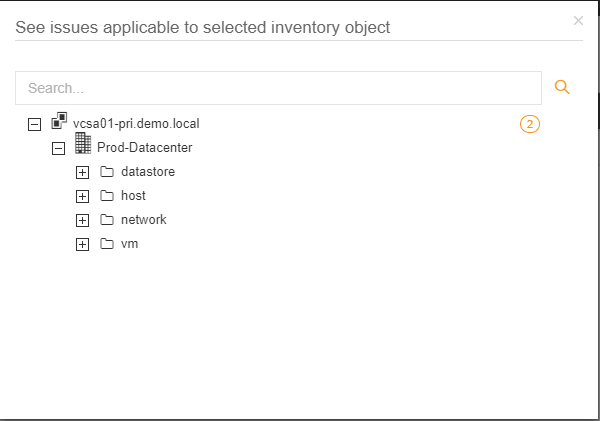
From the above image, you can see that there are two issues with my vCenter Server and expanding each object will show me issues associated with them.
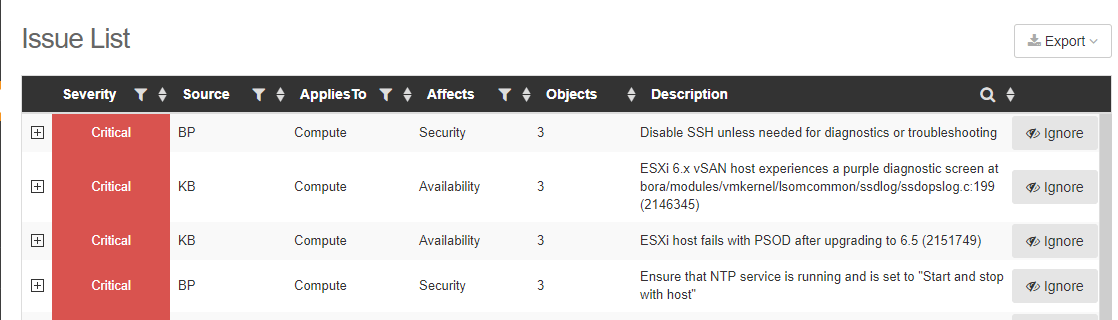
Issue List
This view combines all types of detected issues into a single table – Configuration KB issues, Best Practice, Security Hardening checks and Log KB issues.
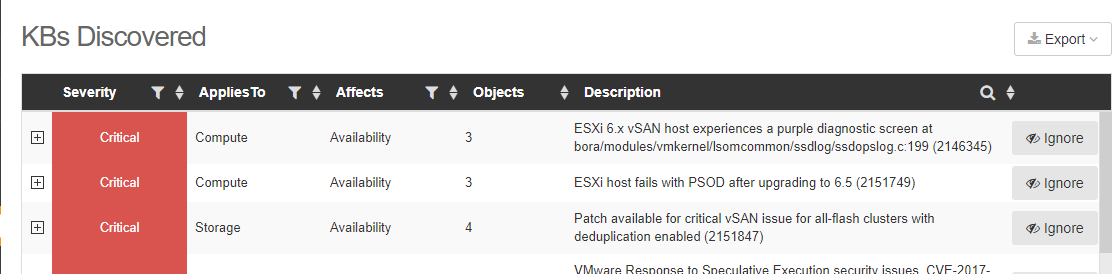
KBs Discovered
This view lists all detected issues on the scanned virtual infrastructure that were derived from VMware Knowledge Base articles.
Best Practices
This is a view which corresponds to the best practices outlined by VMware and if they aren't followed in your Virtual infrastructure.
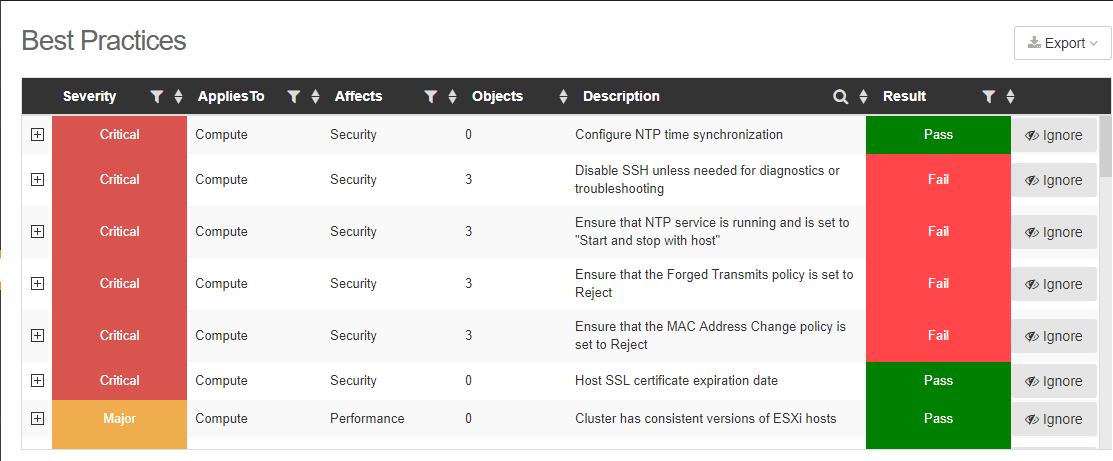
If a specific best practice is followed, the best practice item is marked as ‘Pass’. If it is not followed for at least one of the affected objects, then it is marked as ‘Fail’.
You can click on the '+' symbol to look at more information of the failed scans.
Security Hardening
This section contains security and compliance policies as VMware Guidelines and DISA STIG.
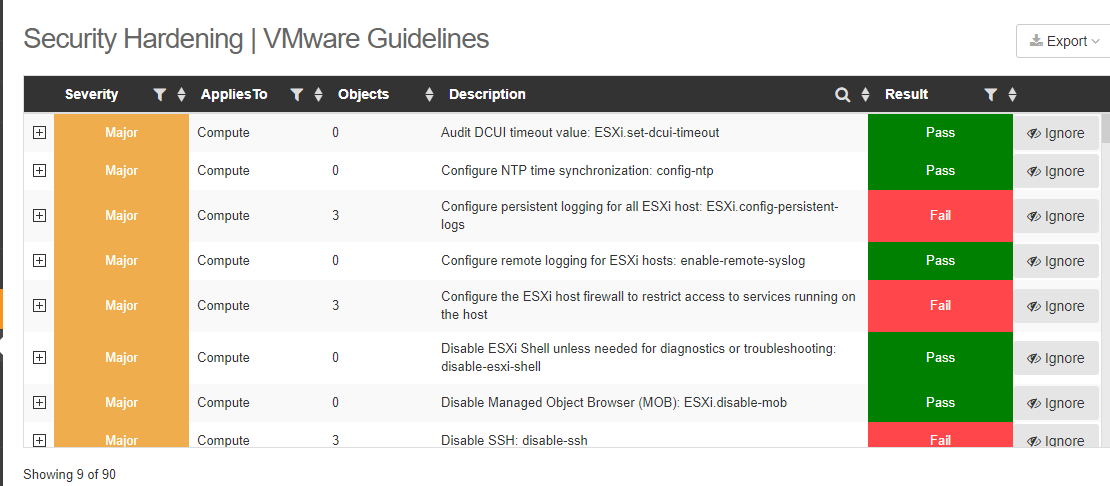
In my case, I am only checking the VMware Guidelines as seen from the above image. There are three types of severities which are relevant to the types of environments:
- Low: Security hardening that is intended for highly secure environments only.
- Medium: Security hardening that relates to common environments.
- Major: Security hardening that can relate to any environment.
And for each type of severity, Runecast will tell you if passed or failed. Expanding the failed item, it presents you with relevant information.
Runecast Settings
As mentioned earlier, I said that we would be visiting the Settings in the future and now is the time to look at these and what they do.
Automatic Scheduler
This is the section where you decide on how you would like to scan your virtual infrastructure.
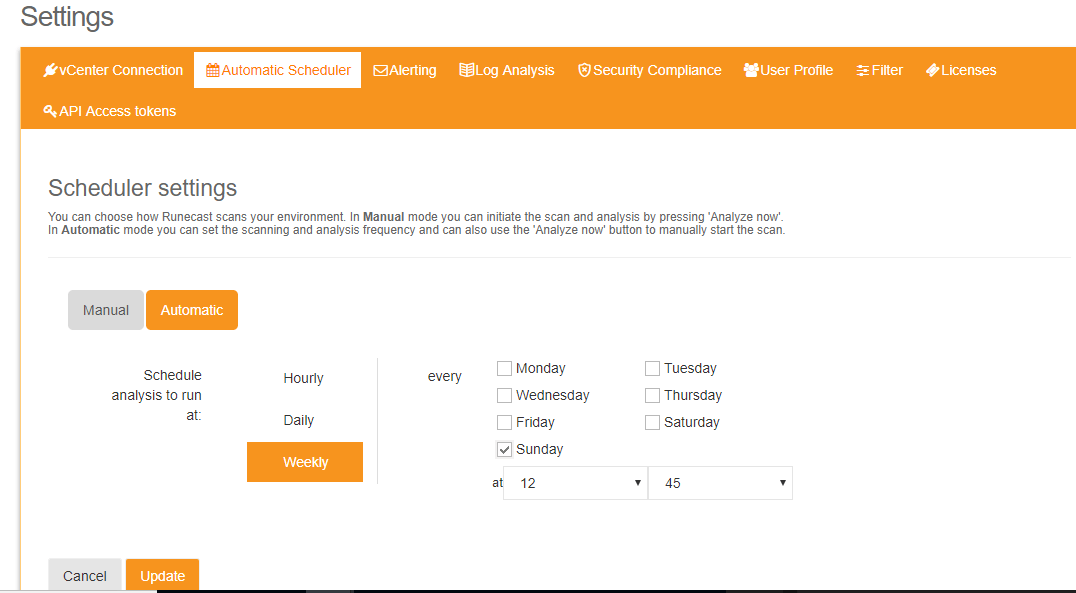
You have an option to choose from Manual and Automatic. I would recommend setting it automatic and selecting a frequency of your choice. I have set mine to weekly once.
You can click on 'Analyze Now' button at any time to trigger a manual scan.
Alerting
This setting can be used to send email notifications to the administrators to take appropriate action.
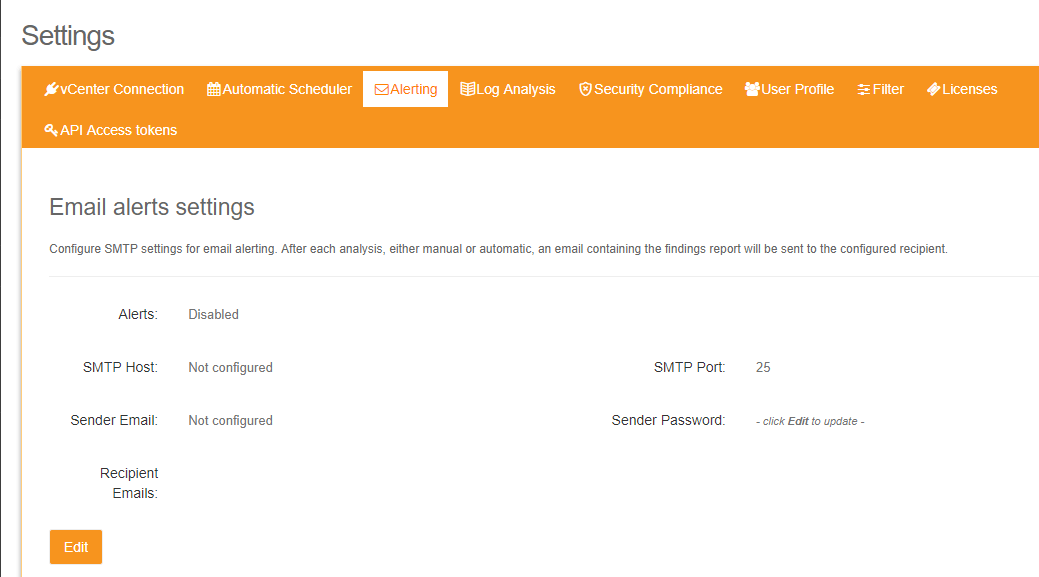
After each analysis, either manual or automatic, an email containing the findings report will be sent to the configured recipient.
Log Analysis
You can configure log retention on the appliance and also configure syslog settings for the ESXi hosts.
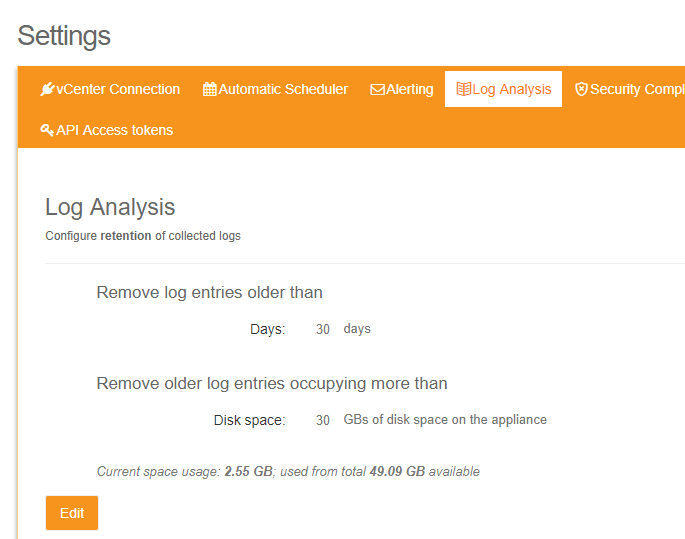
In the above example, I am keeping the logs only for 30 days and older logs will automatically be purged. I am also stating that if the disk space usage for logs is more 30GB, those logs need to be purged.
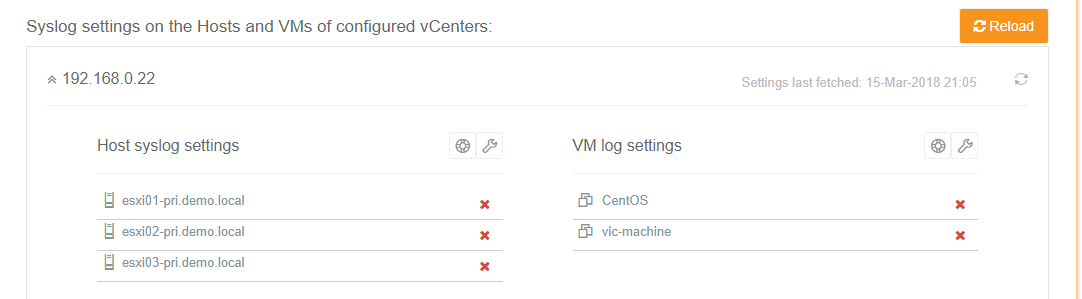
The next setting available on the same page is Syslog settings for ESXi hosts and the Virtual Machines.
Click on Settings icon to forward ESXi host logs to the Runecast appliance.
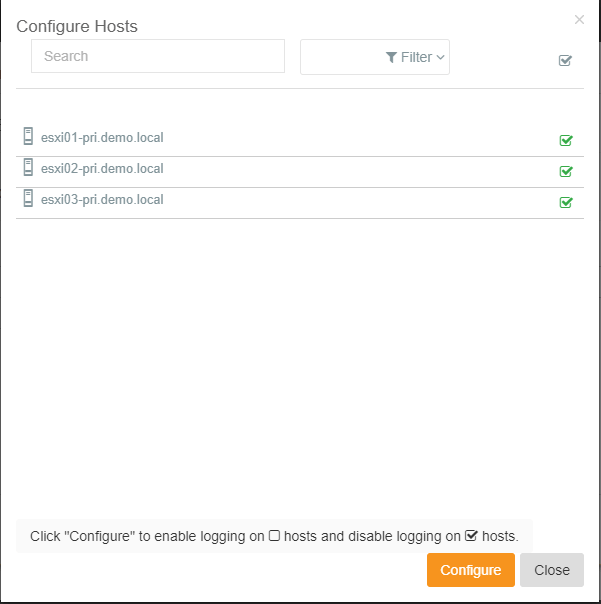
Select the ESXi hosts in this page and click Configure.
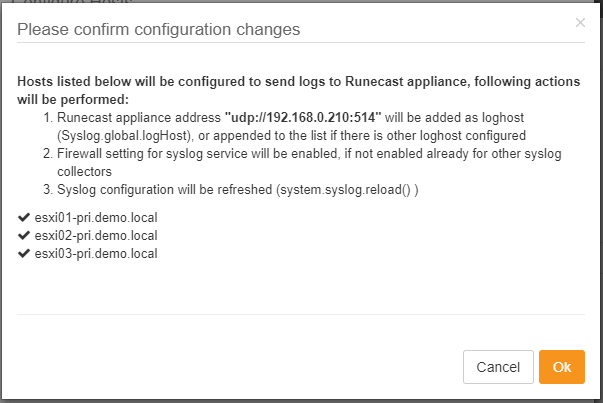
This will bring up the confirmation page, click OK to proceed.
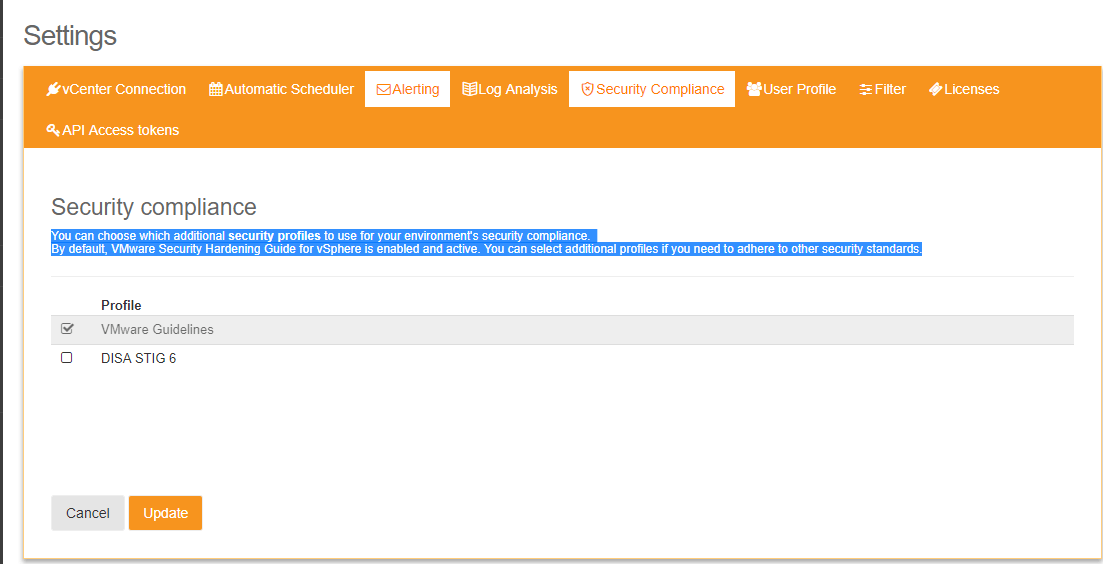
Security Compliance
You can choose which additional security profiles to use for your environment's security compliance.
By default, VMware Security Hardening Guide for vSphere is enabled and active. You can select additional profiles if you need to adhere to other security standards.
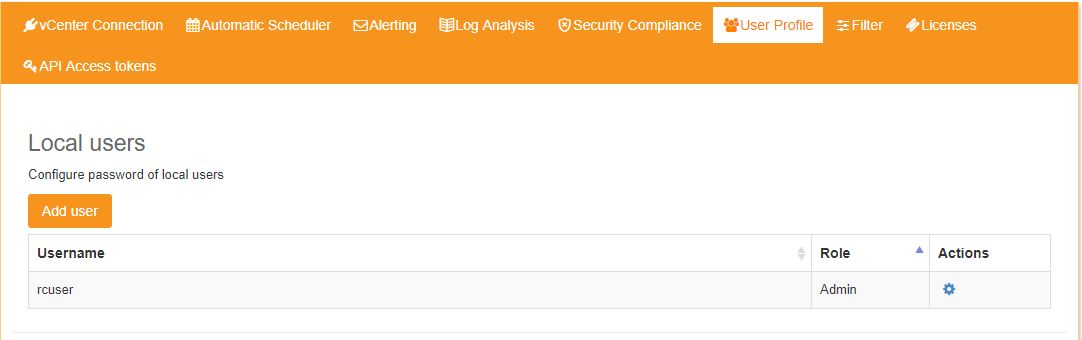
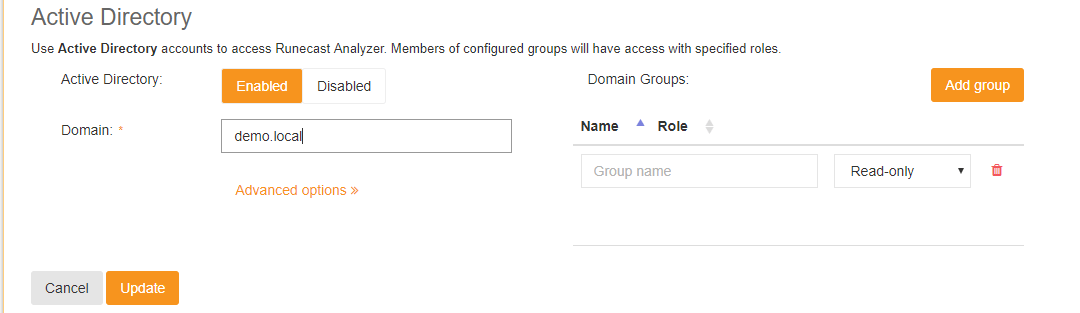
User Profile
This settings page is used to manage local users and add the Runecast appliance to an Active Directory Domain.
API Access Token
Runecast offers REST API functionality to perform custom integrations. One place you can use this to register the Runecast plug-in with the vSphere HTML5 and Flex Client.
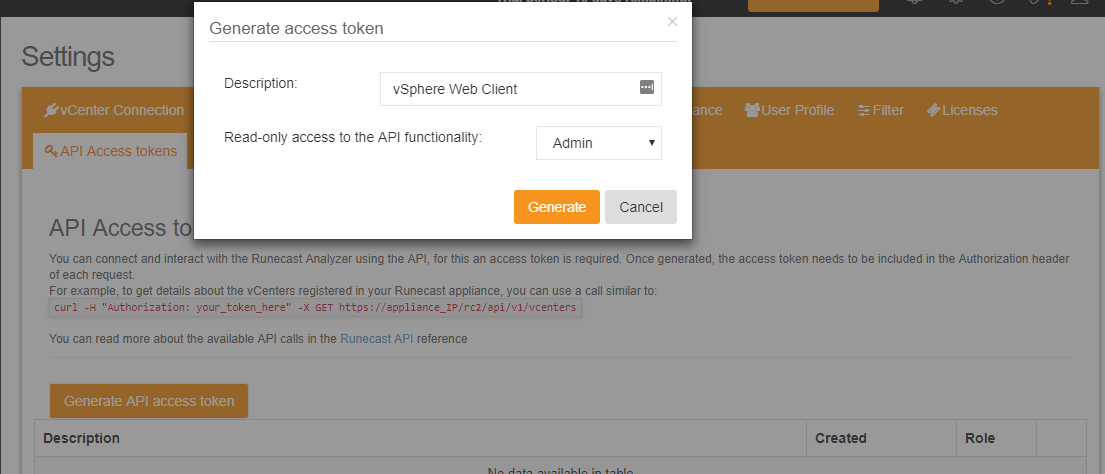
Click on Generate API Access Token and provide a description and click on Generate.
Copy the token which we will be using the next section.
Runecast vSphere Web Client Plug-in
Runecast Plug-in is compatible with both Flex and HTML5 versions of vSphere Web Client. The current version of the plug-in is displaying scan results triggered from Runecast Analyzer or from the plug-in itself.
To register the plug-in, head to Settings > vCenter Connection, select the vCenter Server > Edit> Install Plug-in.
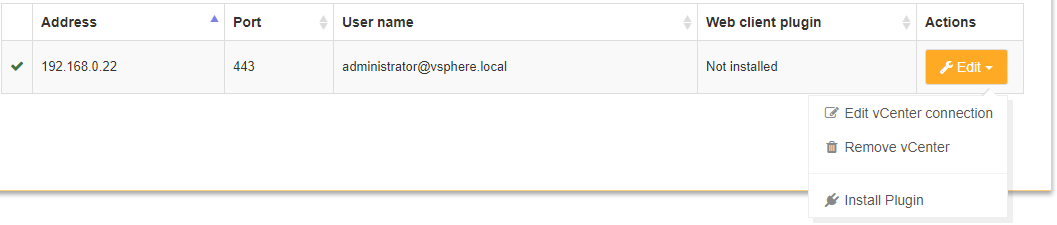
This will bring up a confirmation page, click on Install to finish installing the plug-in.
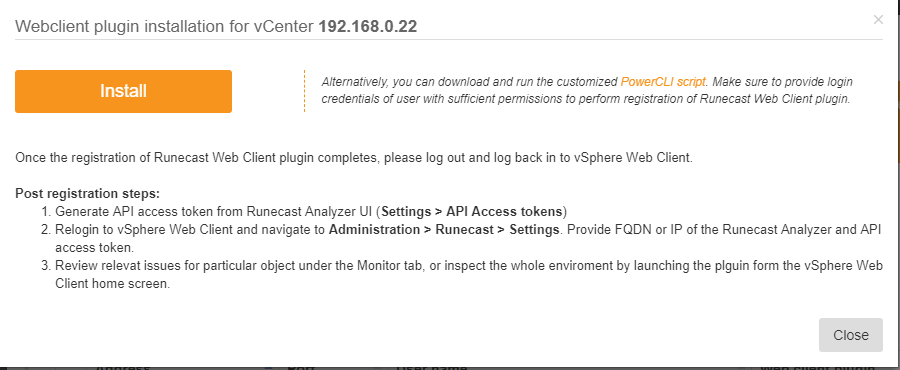
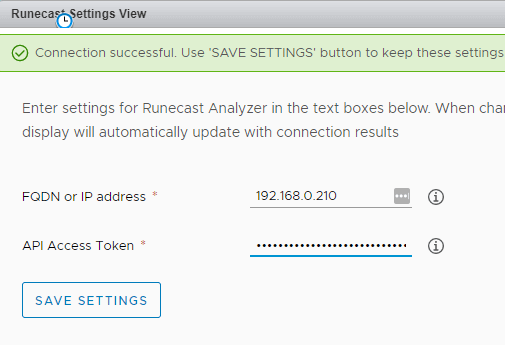
Now, log in to the vSphere Web Client and navigate to Administration section and select Settings under Runecast: Software-Defined Expertise.
Provide FQDN or IP address of Runecast Analyzer and API Access Token that we generated in the previous section, then update settings using the Save Settings button.
The plug-in introduces additional tab named Runecast under Monitor section of each inventory object. There are listed issues, found for the selected object, along with their relevant finding values.
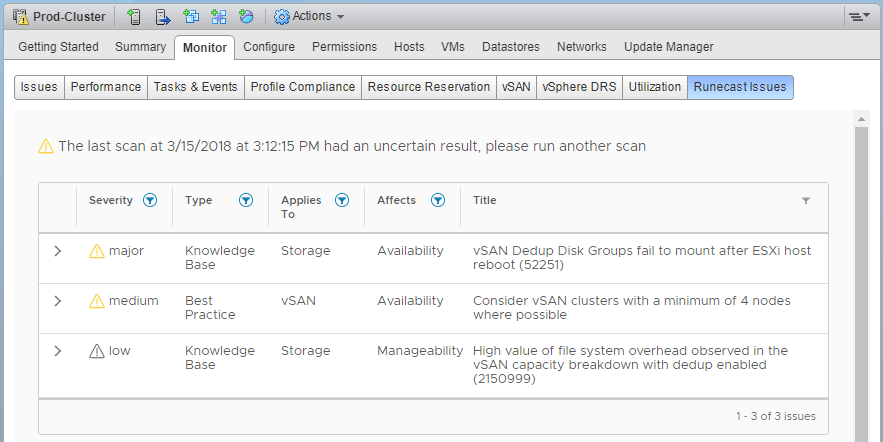
Now instead of logging into the Runecast Appliance, all the issues can be checked from the vSphere Client itself.
Conclusion
Now that I have spent a considerable amount of time with Runecast Analyzer and tested the various features, I believe that this is a tool which should be very handy for any VMware administrator.
This is because it truly is proactive monitoring based on the issues that VMware has identified and posted it online through public facing KB articles. You may be hitting these issues in the future, but Runecast will save you beforehand.
Another cool feature that I liked the most is the ability to forward the logs and Runecast analyzing those and compare them against existing Knowledge Base is just awesome.
Also, the ability to monitor the issues from the Web Client and the feature to send email notifications every time a scan is done, your VMware admins should be able to proactively assess issues and take appropriate actions.
I hope this has been informative and thank you for reading!


 and vCenter Server Deployment Models")