
In this post, we are going to look at the 70-533 Objective 1.3 - Configure diagnostics monitoring and analytics. The Objective 1 of the 70-533 Exam deals with Azure App service and this post will also look at the below sub-objectives related to the same, which are:
- Configure alerts
- Configure diagnostics
- Retrieve diagnostics data
- View streaming logs
- Configure endpoint monitoring
- Use remote debugging
- Monitor Web App resources
Configure Alerts
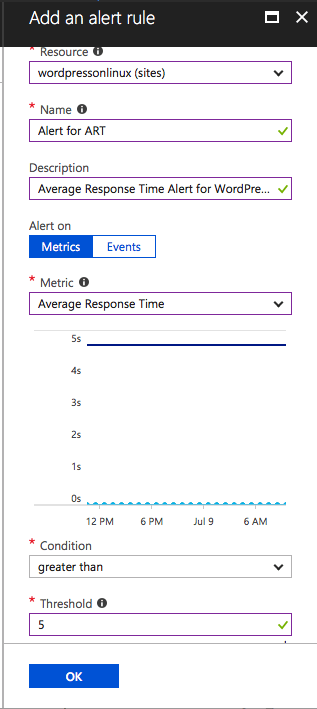
We can turn on alerts on Azure Apps to notify us of something that is not going as planned. To enable alerts on the Web App, select the Web App > Monitoring > Alerts. Click Add.
This brings up a new blade and the following information needs to be filled in to create a successful alert:
- Resource: Select the resource that the alerts act on, this could be the entire App Service Plan or a Web App.
- Name: Provide a descriptive name for the alert.
- Description: Provide a description so that everyone else knows what the alert does at a glance.
- Alert On: There are two options available, Mertic or Events. In our example, we will be selecting the metric called Average Response Time.
- Condition: The condition that the alert needs to satisfy in order to be triggered.
- Threshold: This value defines when the alert will be triggered.
- Period: This value defines how long the threshold should be breached so that the alert can trigger.
- Email: If this checkbox is enabled, an email will be sent to the owners, contributors and the readers.
Below is an image which shows how to create an alert for a Web App in Azure Portal.
Configure Diagnostics
The Azure App Service has a built-in diagnostic that can help you debug your apps. It is not enabled by default.
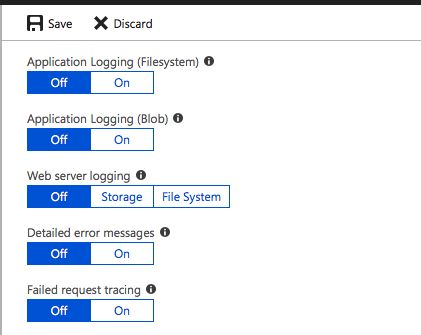
To enable Diagnostic Log, go to the Web App > Monitoring > Diagnostic Logs.
There are various loggings that can be enabled for a Web App which are listed below:
- Application Logging (Filesystem): Enable application logging to collect diagnostic traces from your web app code. You'll need to turn this on to enable the streaming log feature. This setting turns itself off after 12 hours. You can select the Level of Logging here.
- Application Logging (Blob): Logs are collected in the blob container that is specified under Storage settings.
- Web Server Logging: Gather diagnostic information for your web server
- Detailed error messages: Gather detailed error messages from your web app
- Failed request tracing: Gather diagnostic information on failed requests
Retrieve Diagnostics Data
Once diagnostics is enabled on the Azure App Service, you can then download the logs. There are various ways that you can download the logs.
- FTP: Web App > Monitoring > Diagnostic Logs. Use the FTP details
- PowerShell: Use the command "Save-AzureWebSiteLog -Name webappname" to download the logs using PowerShell
- CLI: Use the command "az webapp log download --resource-group resourcegroupname --name webappname"
- Visual Studio: Using Application Insights SDK
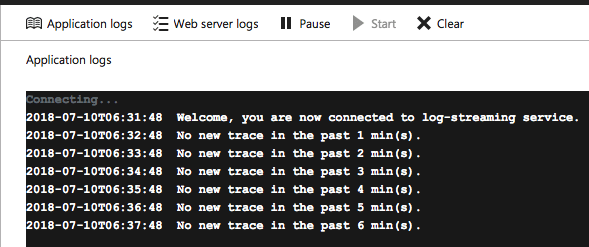
View Streaming Logs
There are a couple of ways that you can stream logs for your Web Apps. First is using the PowerShell cmdlet Get-AzureWebsiteLog.
The command would be as below:
Get-AzureWebsiteLog -Name webappname -Tail
The second way is to stream the logs directly on the Azure Management Portal. Go to Web App > Monitoring > Log Stream.
Use Remote Debugging
You can use Microsoft Visual Studio to perform debugging of your Web App running in Azure App Service. You might remember from earlier posts that you can use Server Explorer to connect to your Azure subscription from Visual Studio and the same steps will be used here.
Providing this information in this blog post is going to be detailed, hence this information can be found below.
Troubleshoot a web app in Azure App Service using Visual Studio
Monitor Web App Resources
You can easily monitor apps in Azure App Service. Also, another important thing to note is that you can keep an eye on Quotas.
If you go above your defined quotas, then your apps would stop working and appropriate actions need to be taken like reduce the usage or change the App Service Plan.
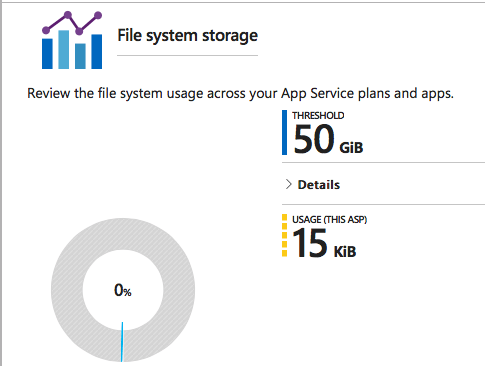
Some of the other monitoring tools available are under Diagnose and solve problems section, click on Performance Counters.
This brings up a whole lot of metrics and they can be used to monitor various resources of your Web App.
I hope this has been informative and thank you for reading!


